Fury on Minikube
This step-by-step tutorial helps you deploy the Kubernetes Fury Distribution on a local minikube cluster.
This tutorial covers the following steps:
- Deploy a local Minikube cluster.
- Download the latest version of Fury with
furyctl. - Install Fury distribution.
- Explore some features of the distribution.
- Teardown the environment.
☁️ If you prefer trying Fury in a cloud environment, check out the Fury on EKS tutorial or the Fury on GKE tutorial.
Prerequisites
This tutorial assumes some basic familiarity with Kubernetes.
To follow this tutorial, you need:
- Minikube - follow the installation guide. This guide is based on Minikube with the VirtualBox driver.
- Docker - a Docker image containing
furyctland all the necessary tools is provided.
Setup and initialize the environment
-
Open a terminal
-
Clone the fury getting started repository containing all the example code used in this tutorial:
git clone https://github.com/sighupio/fury-getting-started/
cd fury-getting-started/fury-on-minikube
Step 1 - Start minikube cluster
- Start minikube cluster:
export REPO_DIR=$PWD
export KUBECONFIG=$REPO_DIR/infrastructure/kubeconfig
cd $REPO_DIR/infrastructure
make setup
⚠️ This command will spin up by default a single-node Kubernetes v1.23.1 cluster, using VirtualBox driver: the node has 4 CPUs, 8192MB RAM and 20,000 MB Disk. Please have a look at Makefile to change the default values. You can also pass custom parameters:
make setup cpu=4 memory=4096
- Run the
fury-getting-starteddocker image:
docker run -ti --rm \
  -v $REPO_DIR:/demo \
  --env KUBECONFIG=/demo/infrastructure/kubeconfig \
  --net=host \
   registry.sighup.io/delivery/fury-getting-started
- Test the connection to the Minikube cluster:
kubectl get nodes
Output:
NAME       STATUS   ROLES    AGE   VERSION
minikube   Ready    master   16m   v1.23.1
Step 2 - Download fury modules
furyctl can do a lot more than deploying infrastructure. In this section, you use furyctl to download the monitoring, logging, and ingress modules of the Fury distribution.
To learn more about furyctl and its features, head to the documentation site.
Inspect the Furyfile
furyctl needs a Furyfile.yml to know which modules to download.
For this tutorial, use the Furyfile.yml located at /demo/Furyfile.yaml:
versions:
  monitoring: v1.14.1
  logging: v1.10.2
  ingress: v1.12.2

bases:
  - name: monitoring/prometheus-operator
  - name: monitoring/prometheus-operated
  - name: monitoring/alertmanager-operated
  - name: monitoring/grafana
  - name: monitoring/goldpinger
  - name: monitoring/kubeadm-sm
  - name: monitoring/configs
  - name: monitoring/kube-state-metrics
  - name: monitoring/node-exporter

  - name: logging/elasticsearch-single
  - name: logging/cerebro
  - name: logging/curator
  - name: logging/fluentd
  - name: logging/kibana

  - name: ingress/nginx
  - name: ingress/forecastle
Download Fury modules
- Download the Fury modules with
furyctl:
cd /demo/
furyctl vendor -H
- Inspect the downloaded modules in the
vendorfolder:
tree -d /demo/vendor -L 2
Output:
vendor
└── katalog
    ├── ingress
    ├── logging
    └── monitoring
Step 3 - Installation
Each module is a Kustomize project. Kustomize allows to group together related Kubernetes resources and combine them to create more complex deployments. Moreover, it is flexible, and it enables a simple patching mechanism for additional customization.
To deploy the Fury distribution, use the following root kustomization.yaml located /demo/manifests/kustomization.yaml:
resources:

  # Monitoring
  - ../vendor/katalog/monitoring/prometheus-operator
  - ../vendor/katalog/monitoring/prometheus-operated
  - ../vendor/katalog/monitoring/grafana
  - ../vendor/katalog/monitoring/goldpinger
  - ../vendor/katalog/monitoring/kube-state-metrics
  - ../vendor/katalog/monitoring/node-exporter
  - ../vendor/katalog/monitoring/alertmanager-operated

  # Logging
  - ../vendor/katalog/logging/elasticsearch-single
  - ../vendor/katalog/logging/cerebro
  - ../vendor/katalog/logging/curator
  - ../vendor/katalog/logging/fluentd
  - ../vendor/katalog/logging/kibana

  # Ingress
  - ../vendor/katalog/ingress/nginx
  - ../vendor/katalog/ingress/forecastle

  # Ingress definitions
  - resources/ingress.yml

patchesStrategicMerge:

  - patches/alertmanager-operated-replicas.yml
  - patches/alertmanager-operated-resources.yml
  - patches/prometheus-operated-resources.yml
  - patches/prometheus-operator-resources.yml
  - patches/grafana-resources.yml
  - patches/kibana-resources.yml
  - patches/elasticsearch-resources.yml
  - patches/fluentd-resources.yml
  - patches/fluentbit-resources.yml
  - patches/nginx-ingress-controller-resources.yml
This kustomization.yaml:
- references the modules downloaded in the previous section
- patches the upstream modules (e.g.
patches/elasticsearch-resources.ymllimits the resources requested by elastic search) - deploys some additional custom resources (e.g.
resources/ingress.yml)
Install the modules:
cd /demo/manifests/

make apply
# Due to some chicken-egg 🐓🥚 problem with custom resources you have to apply again
make apply
Step 4 - Explore the distribution
🚀 The distribution is finally deployed! In this section you explore some of its features.
Setup local DNS
In Step 3, alongside the distribution, you have deployed Kubernetes ingresses to expose underlying services at the following HTTP routes:
forecastle.fury.infografana.fury.infokibana.fury.info
To access the ingresses more easily via the browser, configure your local DNS to resolve the ingresses to the external Minikube IP:
- Get the address of the cluster IP:
minikube ip
<SOME_IP>
- Add the following line to your local
/etc/hosts:
<SOME_IP> forecastle.fury.info alertmanager.fury.info goldpinger.fury.info grafana.fury.info prometheus.fury.info kibana.fury.info
Now, you can reach the ingresses directly from your browser.
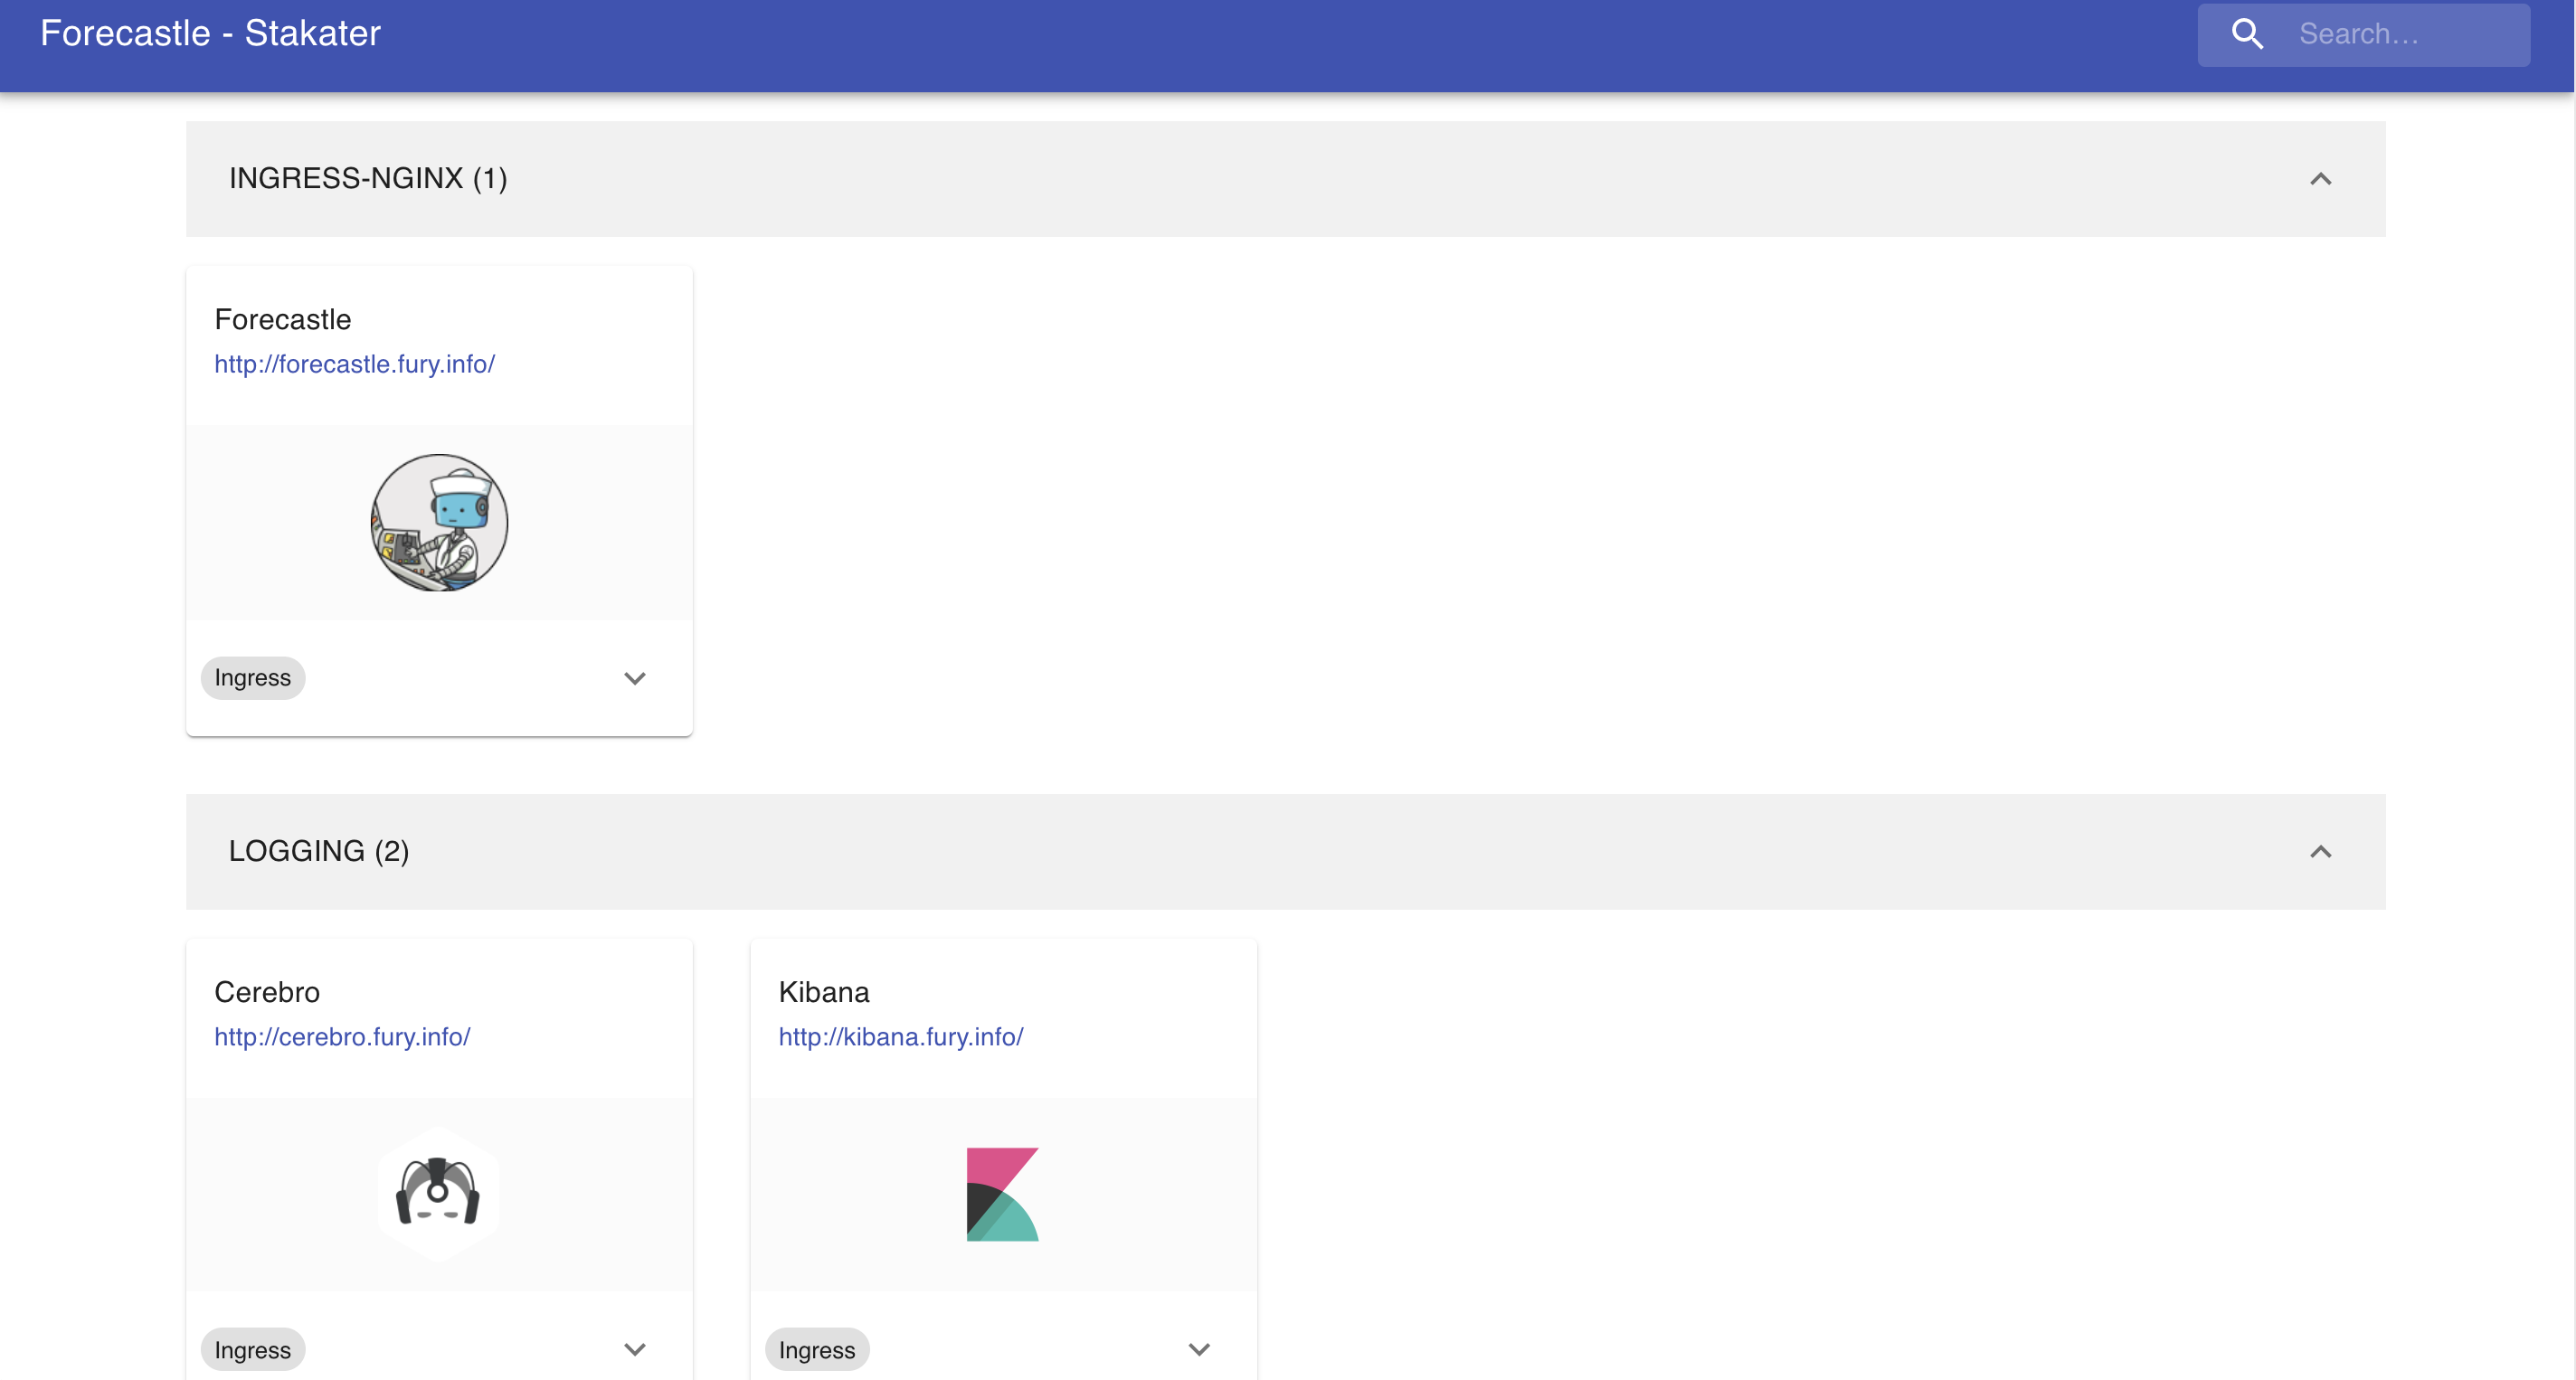
Forecastle
Forecastle is an open-source control panel where you can access all exposed applications running on Kubernetes.
Navigate to http://forecastle.fury.info to see all the other ingresses deployed, grouped by namespace.
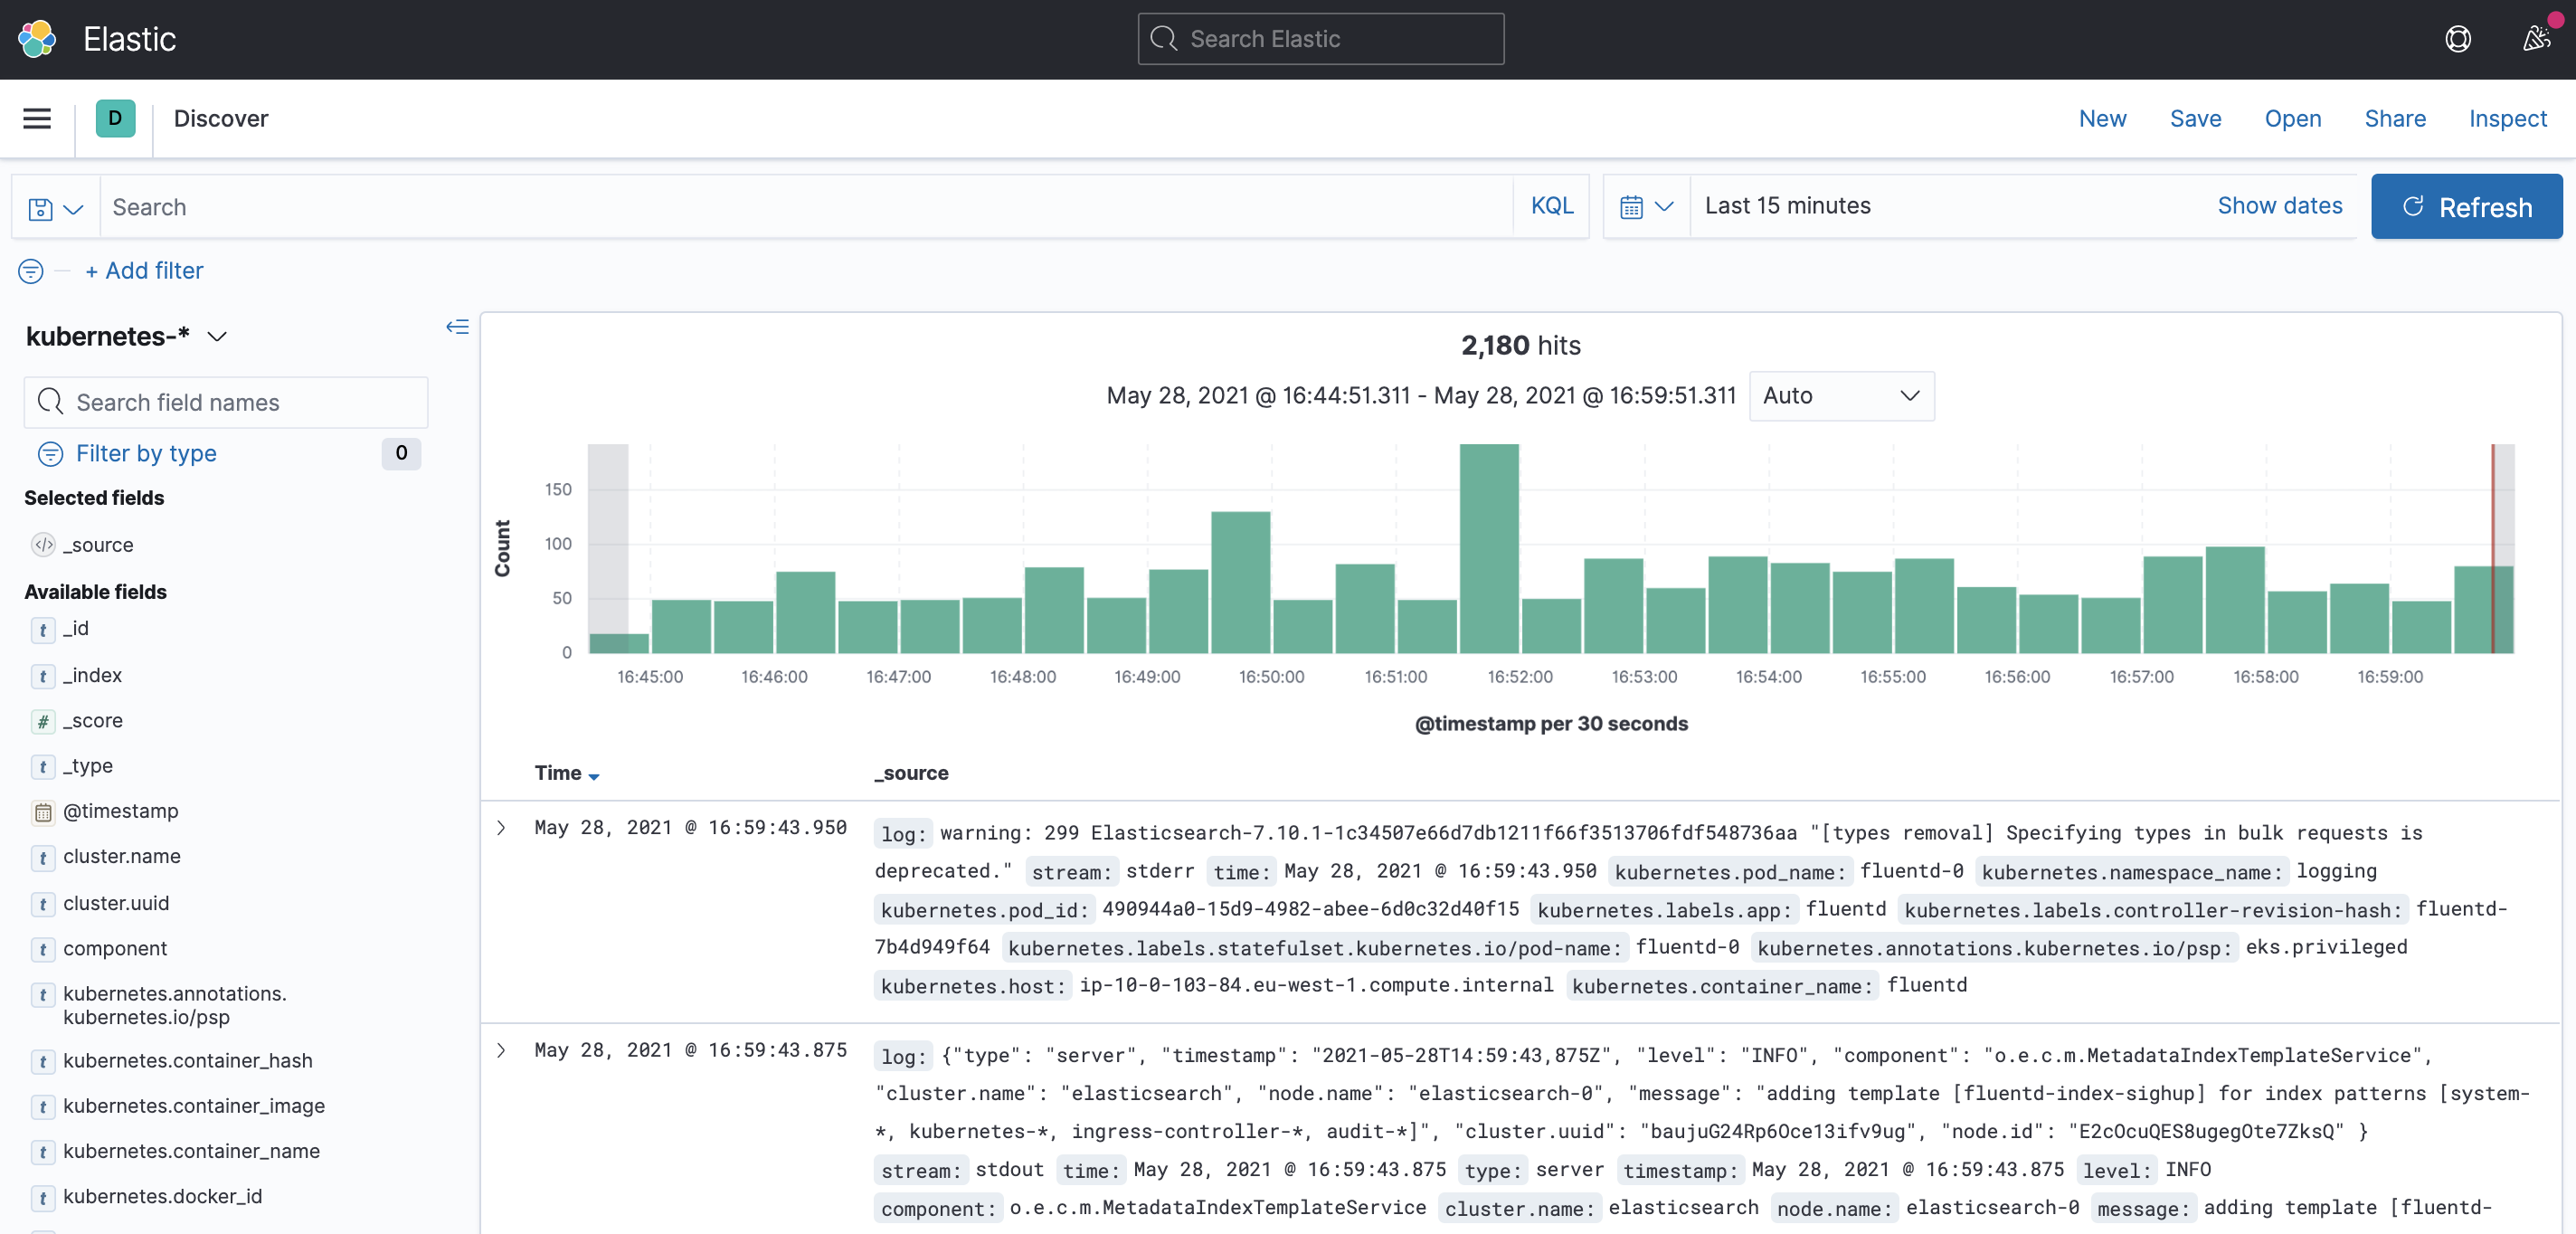
Kibana
Kibana is an open-source analytics and visualization platform for Elasticsearch. Kibana lets you perform advanced data analysis and visualize data in various charts, tables, and maps. You can use it to search, view, and interact with data stored in Elasticsearch indices.
Navigate to http://kibana.fury.info or click the Kibana icon from Forecastle.
Click on Explore on my own to see the main dashboard.
Create a Kibana index
- Open the menu on the right-top corner of the page.
- Select
Stack Management(it's on the very bottom of the menu). - Select
Index patternsand click onCreate index pattern. - Write
kubernetes-*as index pattern and flag Include system and hidden indices - Click
Next step. - Select
@timestampas time field.s - Click create the index.
Read the logs
Based on the index you created, you can read and query the logs.
Navigate through the menu again, and select Discover.
Grafana
Grafana is an open-source platform for monitoring and observability. Grafana allows you to query, visualize, alert on and understand your metrics.
Navigate to http://grafana.fury.info or click the Grafana icon from Forecastle.
Fury provides some pre-configured dashboard to visualize the state of the cluster. Examine an example dashboard:
- Click on the search icon on the left sidebar.
- Write
podsand click enter. - Select the
Kubernetes/Podsdashboard.
This is what you should see:

Step 6 - Tear down
- Stop the docker container:
# Execute this command inside the Docker container
exit
- Delete the minikube cluster:
# Execute these commands from your local system, outside the Docker container
cd $REPO_DIR/infrastructure
make delete
Conclusions
Congratulations, you made it! 🥳🥳
We hope you enjoyed this tour of Fury!
Issues/Feedback
In case your ran into any problems feel free to open a issue here in GitHub.
Where to go next?
More tutorials:
More about Fury: