SD On High-Density Bare-Metal Nodes
We received some requests about running our distribution on bare-metal nodes. Typically, those are server-grade machines with lots of resources in terms of CPUs and RAM, where users would like to run their workload with a higher pod density than Kubernetes' default, which is more tailored towards smaller VMs that can be scaled horizontally.
We chose to try for ourselves this approach, so we could test and implement new features specifically for this use case iteratively. Then, we conducted a few stress tests to see how dense we could get before getting any issues.
We reached a status where our distribution is very easily configurable to run in such big, bare-metal machines and host a number of pods per node well beyond the default 110.
This is a report of our execution of kube-burner to stress-test a bare-metal cluster running SIGHUP Distribution v1.33.1.
The Goals
We wanted to:
- Test the installation of SD on bare metal machines
- Check if we could make the installation process more configurable without increasing the complexity (spoiler: yes, and we did!)
- Run at least 350 pods per node
Architecture
We ran all tests using 4 bare-metal machines that we control directly. Specifically:
- All nodes have the same specs:
- 40CPUs
- 512GB RAM
- 50GB system disks
- 2 data NICs bonded for failover
- 2 NICs directly linked to a SAN
- Ubuntu 24.04 on all nodes
- K8s cluster with 3 control-plane nodes (with etcd) and 1 worker node
- HAProxy VM in front of the bare-metal nodes to balance the 3 K8s API Servers and Ingresses
Additionally, we also wanted to test with and without kube-proxy using Cilium's replacement in its place, so to properly compare results we ran two sets of identical tests on the same machines, recreating the cluster from scratch before invoking kube-burner.
Distribution configuration
We installed SD in the cluster with the following configuration:
- Version 1.33.1
- OnPremises provider
- ETCD Encryption at rest enabled
- Auth:
none - DR:
none - Ingress:
dual - Logging:
none - Monitoring:
prometheus - Networking: both
ciliumandcalico - Policy:
kyverno - Tracing:
none - Plugins:
- CSI Operator for our SAN
- CSI configuration for our SAN
- StorageClass
Workload
We wanted to schedule workload pods on all nodes because they all share the same specs. If we left the default configuration, control-plane nodes would be tainted and they could not schedule any workload, making them a waste of resources. This aspect can be easily configured on SD with just one line:
spec:
  kubernetes:
    masters:
      ...
      taints: []
Basically, when you define the taints array for the control-plane nodes, SD will completely overwrite whatever default they may have. Setting them to an empty array configures them to have no taints, so they can be considered candidates by the scheduler.
Kernel Parameters
When we created ~350 pods in one node, we were getting a lot of too many open files errors when trying to view logs. This is due to the rather conservative defaults provided by Ubuntu for inotify, which is used extensively by the kubelet to watch for changes in files (for example when invoking kubectl logs).
In light of this issue, and possibly many others that we could not anticipate properly, we decided to implement a feature where users can specify values for arbitrary Linux kernel parameters, which will be applied on nodes using sysctl. This enabled us to specify higher values for inotify:
spec:
  kubernetes:
    advanced:
      kernelParameters:
        - name: "fs.inotify.max_user_instances"
          value: "8192"
        - name: "fs.inotify.max_user_watches"
          value: "524288"
We would strongly recommend to set those values when installing in bare-metal enviroments in general, because we assume users want to achieve high pod density and they are surely going to face issues without customizing those values. You could also need different parameters depending on the workload that will be running on nodes (e.g.: setting higher values for vm.max_map_count for OpenSearch), so we chose to give users the flexibility of configuring kernel parameters on all nodes or per node groups:
spec:
  kubernetes:
    nodes:
      - name: group1
        kernelParameters:
          - name: "param"
            value: "custom"
        ...
      - name: group2
        kernelParameters:
          - name: "param"
            value: "other_custom"
        ...
Networking
Our goal is to reach at least 350 pods per node (and possibly higher), so we configured the networking as follows:
- Cilium
- Calico
spec:
  kubernetes:
    podCidr: 172.17.128.0/17
    svcCidr: 172.17.0.0/17
    ...
    advanced:
      kubeletConfiguration:
        maxPods: 500
  ...
  distribution:
    modules:
      networking:
        type: cilium
        cilium:
          maskSize: "23"
spec:
  kubernetes:
    podCidr: 172.17.128.0/17
    svcCidr: 172.17.0.0/17
    ...
    advanced:
      kubeletConfiguration:
        maxPods: 500
  ...
  distribution:
    modules:
      networking:
        type: calico
        tigeraOperator:
          blockSize: 23
Kube-burner configuration
We used the kubelet-density-heavy job example provided by kube-burner and slightly changed it to inject an additional parameter nodeSelector, so we would be able to choose to trigger an execution that would place pods on a single node.
The kube-burner job will deploy:
- a PostgreSQL server
- a Deployment with a perfapp that connects to the PostgreSQL server
- a Service to expose the perfapp Deployments
We configured the job to create 15 copies of each resource.
This is a good overall stress test, as it creates pods that actually communicate with each other, and the perfapp is configured to report readiness only when it successfully runs a query on the DB.
From that, we will instruct kube-burner to run either 16 iterations on a single node or 60 iterations across all nodes.
All results are indexed in an external OpenSearch instance, running on the local machine used to trigger the runs, and visualized with Grafana on a dedicated dashboard.
Reports
Generally speaking, the cluster is more than capable of reaching ~500 pods per node: we reached 93% of our total pod capacity without issues with and without kube-proxy.
etcd
We did notice some issues when we ran kube-burner the first time, when we were testing the cluster on the system disks.
The errors were mostly related to leader re-elections for the etcd cluster due to the high latency when writing data.
This, in turn, caused some delays for API server requests, which resulted in the control plane not being available and more time spent creating pods in consequence.
Our suggestion is to make sure that you follow etcd's recommendations and run some preliminary tests on disks, for example:
$ mkdir test
$ fio --rw=write --ioengine=sync --fdatasync=1 --directory=test --size=22m --bs=2300 --name=mytest
Look at the 99.00th percentiles for sync operations: they should be less than 10ms.
mytest: (g=0): rw=write, bs=(R) 2300B-2300B, (W) 2300B-2300B, (T) 2300B-2300B, ioengine=sync, iodepth=1
fio-3.39
Starting 1 process
mytest: Laying out IO file (1 file / 22MiB)
...
  fsync/fdatasync/sync_file_range:
    sync (usec): min=235, max=12624, avg=1008.40, stdev=795.79
    sync percentiles (usec):
     |  1.00th=[  281],  5.00th=[  306], 10.00th=[  326], 20.00th=[  359],
     | 30.00th=[  404], 40.00th=[  553], 50.00th=[ 1123], 60.00th=[ 1188],
     | 70.00th=[ 1237], 80.00th=[ 1319], 90.00th=[ 1549], 95.00th=[ 2089],
     | 99.00th=[ 4228], 99.50th=[ 5342], 99.90th=[ 8094], 99.95th=[ 9372],
     | 99.99th=[11469]
...
If they show higher latencies, change disks or use a fast SAN.
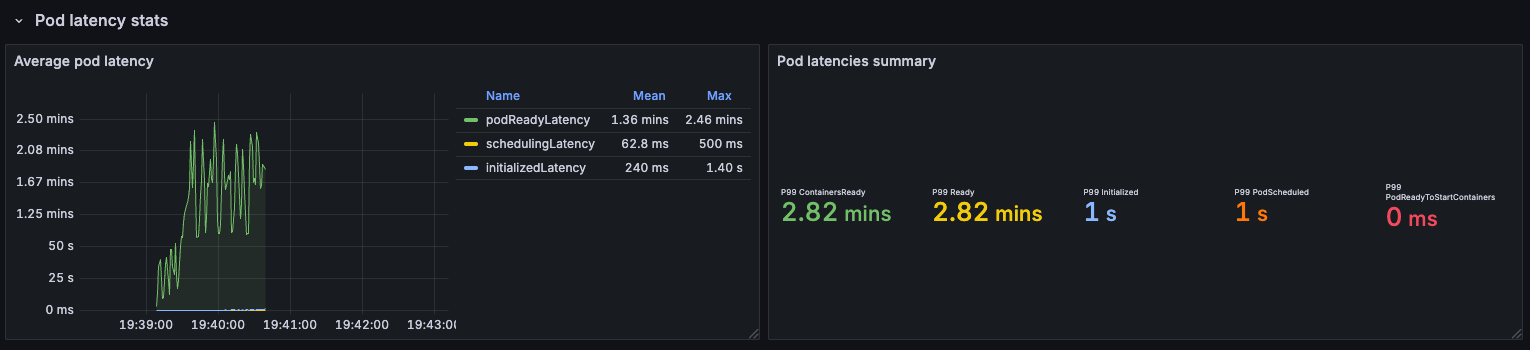
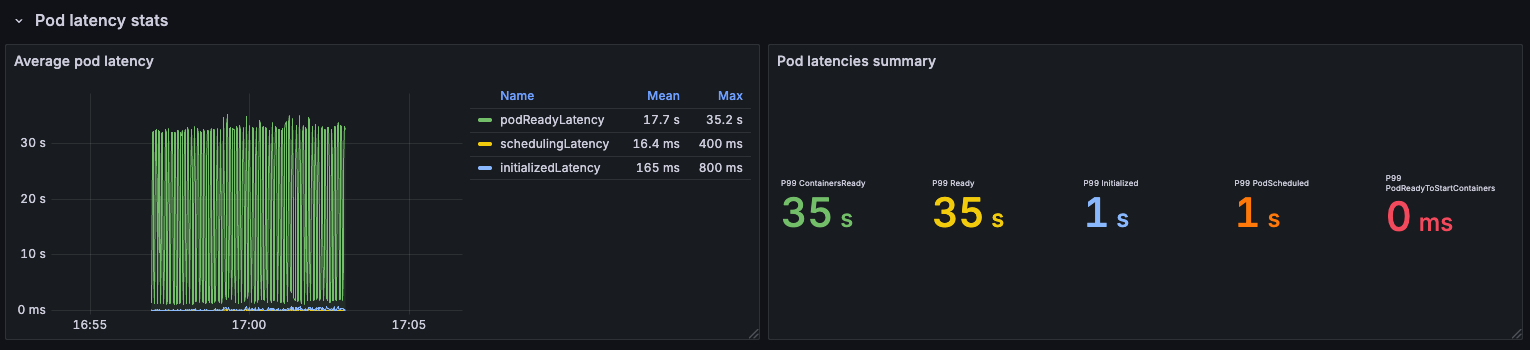
Pod latency stats
The main takeaway is that in some situation it will take longer to reach pod readiness when the cluster is so loaded, because the kubelet needs to keep track of more objects.
Interestingly, the longest wait time was ~3 minutes but only when running tests on a single node:
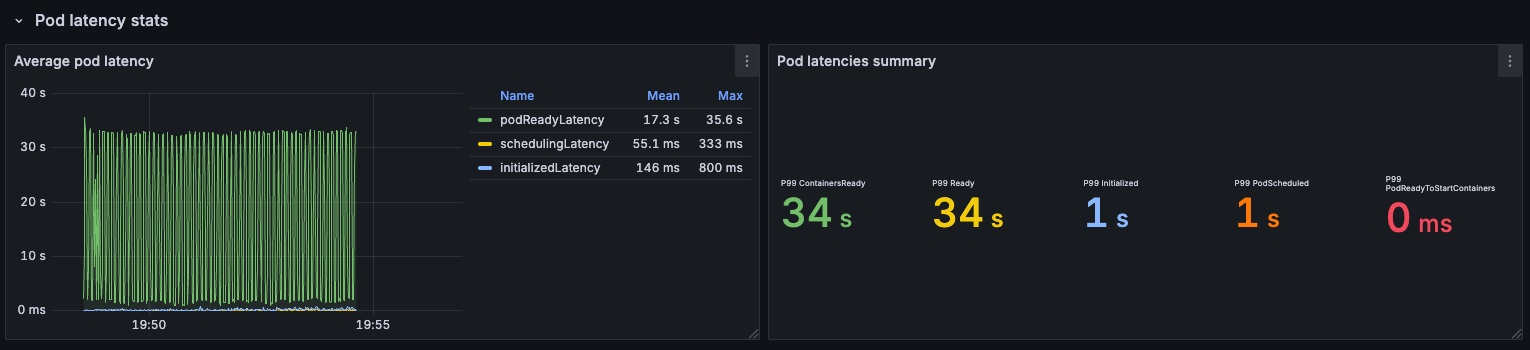
In contrast, when we created 1800 pods across all nodes, the maximum time from scheduling to readiness was 34 seconds:
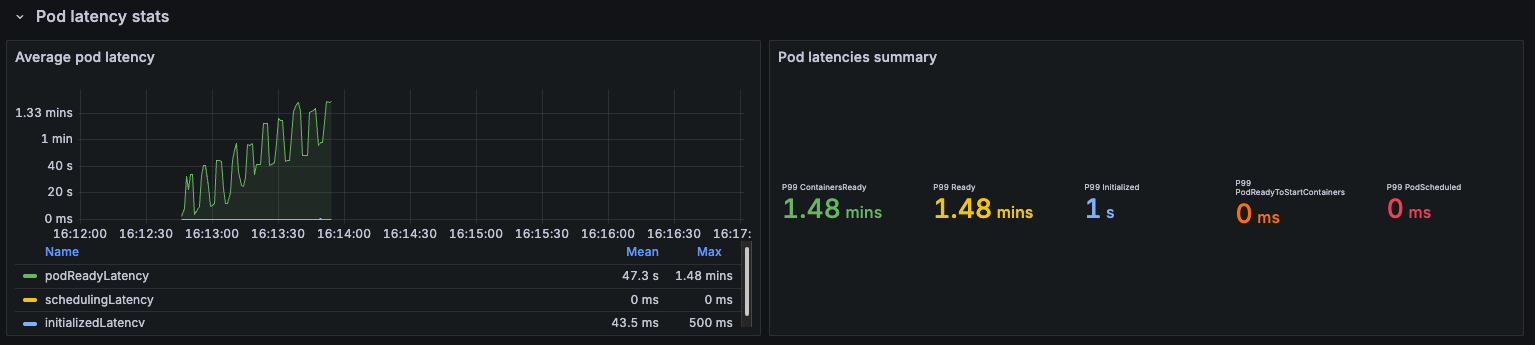
Kube-Proxy vs Cilium's replacement
Cilium's replacement for kube-proxy shows that there is a difference in terms of pod latencies:
However, you should take these findings with a grain of salt, as in some other runs we observed that cilium's replacement was not so much better:
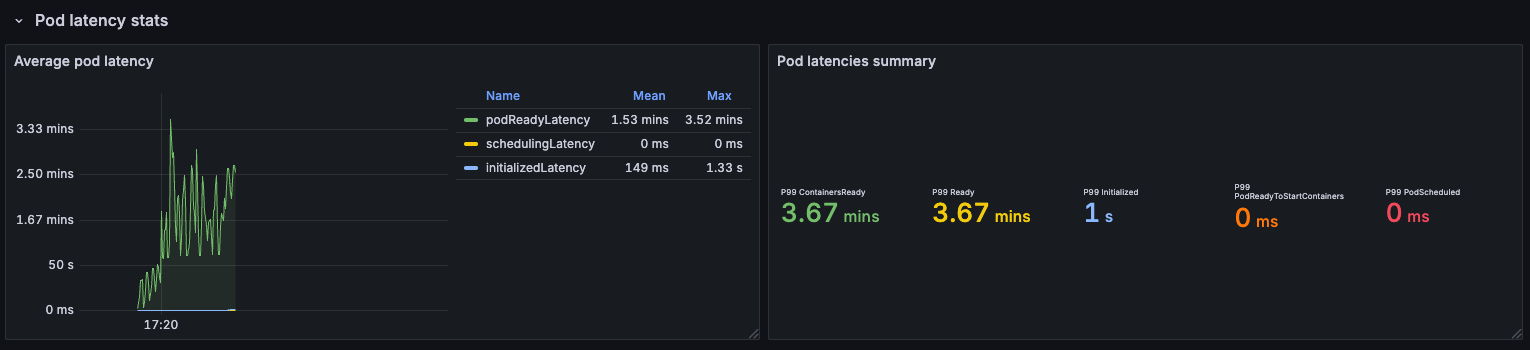
This might indicate that there are also external factors that have nothing to do with Kubernetes that can influence these results.
This difference somehow tends to level when involving all nodes:
Prometheus
One key aspect to keep in mind is Prometheus' RAM usage: it reached ~5GB during the most intensive runs:
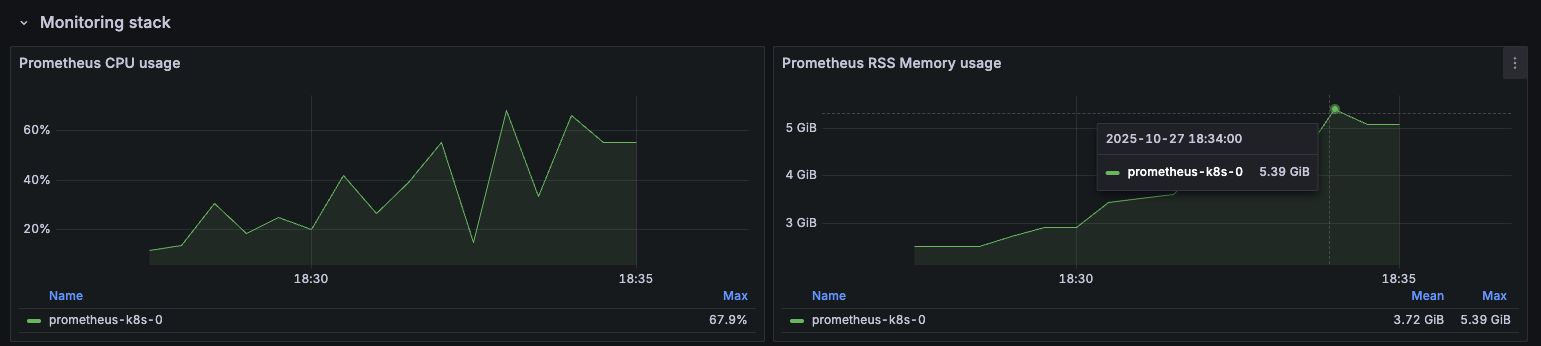
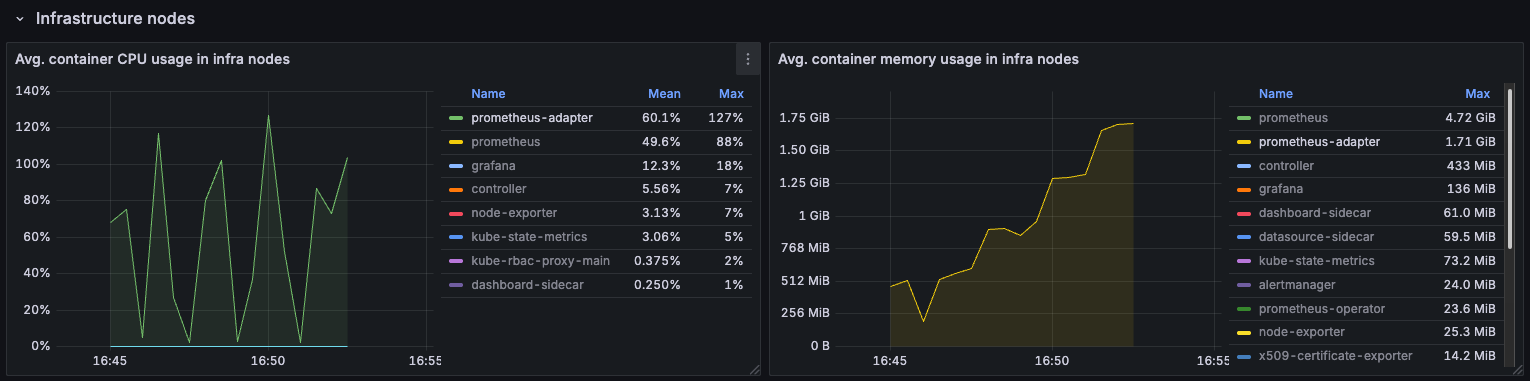
The components of the Monitoring module, particularily Prometheus/Mimir and Prometheus Adapter, do have a direct correlation between their RAM usage and the number of pods in the cluster, so you will probably want to take that into account and set an appropriate amount of resources in .spec.distribution.monitoring.{prometheus|mimir} and .spec.distribution.monitoring.prometheusAdapter. Also, if you want to retain metrics for longer periods of time, you may need to increase the storage size.
If you don't need the collection of enhanced HPA metrics, you should set .spec.distribution.monitoring.prometheusAdapter.installEnhancedHPAMetrics to false, as it greatly decreases Prometheus Adapter's resources usage:

We did not conduct a stress test on the logging stack, but we advise to keep in mind that running more pods means having more logs to process, which results in higher utilization of resources for logging components.
Maybe you could design a test that spans over a longer period of time with containers that produce a prod-like amount of log lines, and adjust the configuration also in .spec.distribution.modules.logging.operator, .spec.distribution.modules.logging.{loki|opensearch} and the storage sizes of both Fluentd buffers and long-term buckets.
Kyverno
We included Kyverno in our testing environment in Audit mode, so that we could measure the impact it can have when executing a high number of checks.
Even if it's only auditing, Kyverno will still perform its verification processes, which result in extra API requests. However, their latencies are reasonably low:
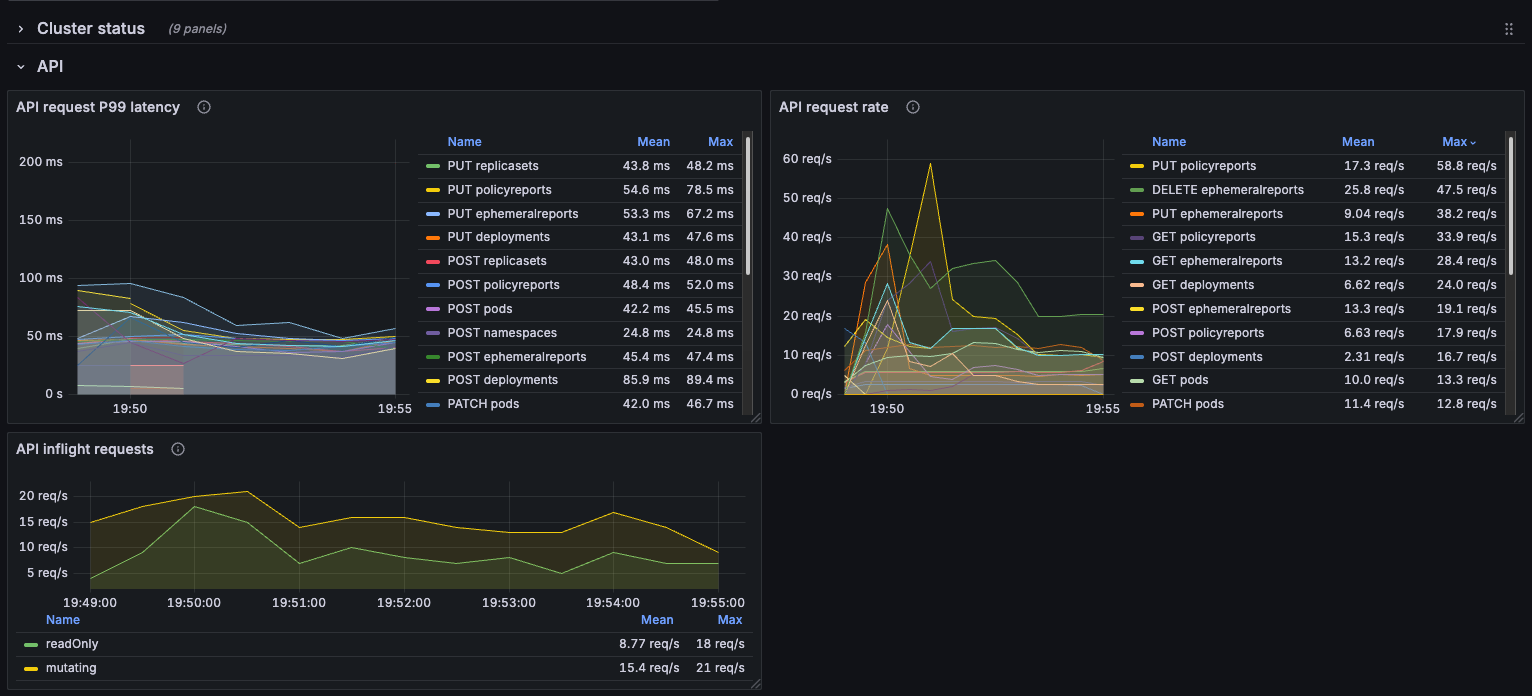
Even when operating on 1800 pods, the overall cluster performance enables Kyverno to perform checks without impacting too much negatively on the final result.
Summary
The following tables summarize the overall findings:
| Run conditions | Pods | Pod latencies (99th percentiles) ContainersReady | Ready | Initialized | Scheduled | PromAdapter RAM | Total time |
|---|---|---|---|---|
| - Single node - with kube-proxy | 480 | |||
2.82 m | 2.82 m | 1s | 1s | 773MB | 234s |
| - All nodes - with kube-proxy | 1800 | |||
34s | 34s | 1s | 1s | 1.68GB | 438s |
| - Single node - without kube-proxy | 480 | |||
1.48 m | 1.48 m | 1s | 0s | 895MB | 268s |
| - All nodes - without kube-proxy | 1800 | |||
35 s | 35 s | 1s | 1s | 1.54GB | 437s |
| - All nodes - without kube-proxy - no HPA metrics | 1800 | |||
34 s | 34 s | 1s | 1s | 46.5MB | 436s |
Closing notes
Our findings show that SIGHUP Distribution is more than capable of running a considerably high number of pods configuring a just a few parameters in the config file. There still are some things to keep in mind when configuring a bare metal environment:
- Make sure the hardware performance is adequate, especially for
etcd - Plan your networking before putting actual workload in the cluster, using your desired target pods per node number as the main factor
- Take some time to run stress tests, using workload that closely resembles what you will be going to run in a real scenario
- You can check the configuration we used for our tests in the distribution repository. Feel free to use it as a base for your own evaluations!
- Monitor SD modules constantly, and adjust resources as necessary. This is especially true for the
monitoringandloggingmodules, which will need more resources to handle a high number of running pods
To find out how to configure SD for a bare-metal environment, you can check the Install SD on Bare-Metal Nodes document.